

A weekly read of volatility, valuation and the week ahead across crypto, foreign exchange and commodities.
This is the subscriber tier, and it is free while we build the list. We will tell you before that changes.
Data captured at 10:16 GST on 25 August 2026. Every figure below is stamped to a period. This is the accountable read behind the free weekly: the changes since last week, the levels to watch, and a claim we will score in the next issue.
The one chart: bitcoin against its long-run trend
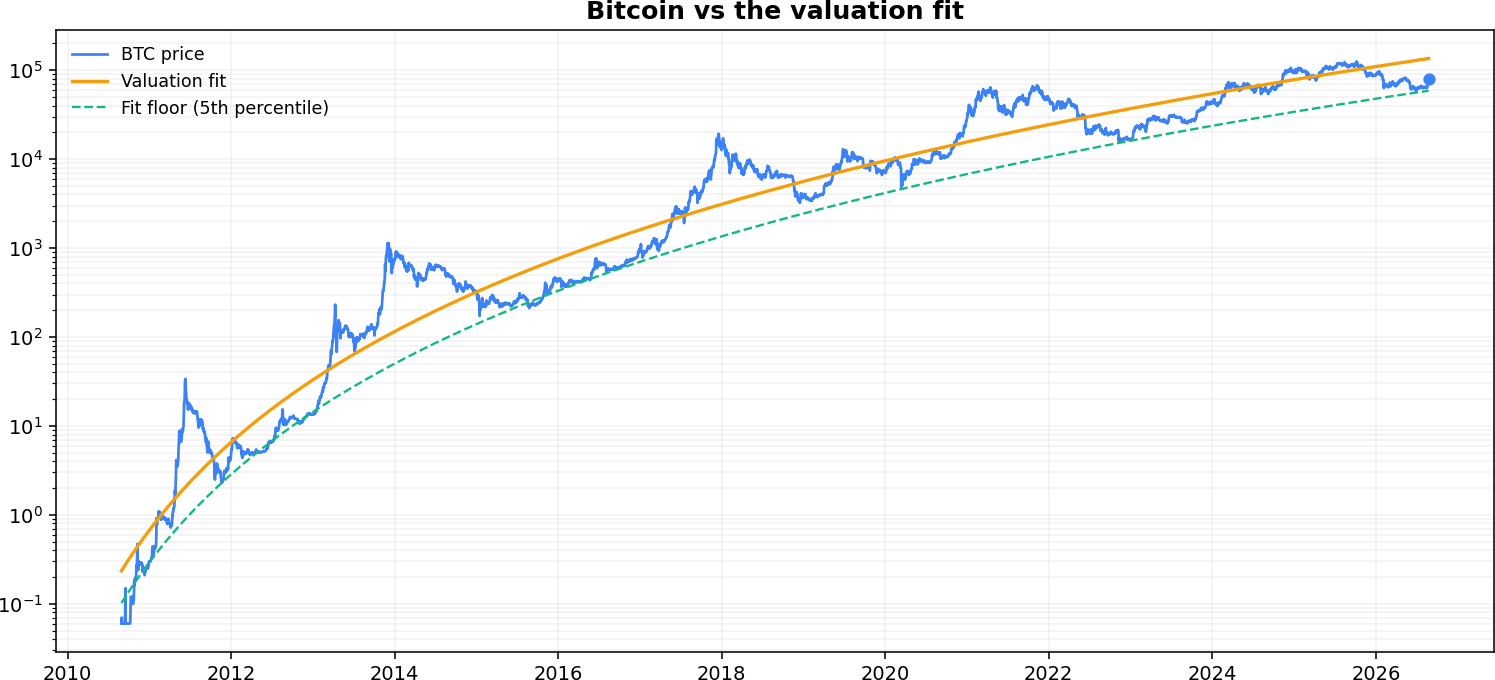
Bitcoin is near 79,000 dollars. The valuation fit models price against how long the network has existed, on a log-log scale. Fair value on that fit lands near 135,000, about 42 percent below the line, and the fitted floor sits near 59,000.
Bitcoin has closed above that floor line for roughly 95 percent of the historical sample. That is an in-sample observation, not a tested probability and not a guaranteed level of support.
Our cycle gauge reports a second number, and it is worth being precise about what it is. It fits the same shape of curve, price against network age, but on a different price history and with a different band, then adds halving timing to classify the phase. It reads bitcoin as post-peak cooldown, about 43 percent below its own trend line. Do not read the two figures as confirming each other. They are the same kind of fit run over overlapping data, so close agreement is close to guaranteed and tells you nothing the first number did not.
Both are long-horizon context. Where price sits against a multi-year fit says nothing about the next five days, so read it as valuation, not a reason to act on the week.
What the model can and cannot do
It is a statistical fit of price to time. It has no hard economic mechanism behind it, cannot call tops, and may fail outside the historical sample. It is a valuation anchor, not a timing tool. Treat the fair value and the floor as distant reference points, never as targets and never as a reason to size up.
The seven-day volatility map
This is the part with measurable skill. The model tags each market turbulent or calm for the week ahead. In the five-year point-in-time backtest it classified the seven-day regime correctly about 66 percent of the time, 11 percentage points above its naïve baseline, and 73 percent at thirty days, 17 points above baseline. That is a backtest, not a live forward record: the live scoreboard is only now starting to fill.
Turbulent for the coming week: bitcoin, ether, gold, silver, platinum, USDCHF.
Calm: the rest of the displayed set, including solana, six of the seven FX pairs, the S&P 500, oil, copper and natural gas.
The average market is therefore contained even though a few names are carrying wide ranges.
The loudest reads are in big crypto
Bitcoin’s one-week volatility is near 54 percent against a 39 median. Ether is near 102 against 53, close to double its normal. Both are turbulent at seven days while their thirty-day classifications remain calm. The two horizons disagree, which flags a near-term disturbance without telling us whether it will last.
The metals read turbulent at both seven and thirty days, indicating that their elevated-volatility classification extends beyond the coming week.
On direction the model is close to a coin flip: 49 percent over 320 backtested crypto calls. We forecast volatility, not direction.
What changed since the last Signal
From next week this section flags which markets newly flipped turbulent or calm and how far bitcoin moved against its fitted value, so you can see what changed rather than only the latest state.
The week behind, and what it rhymes with
Over the past seven days crypto was broad and speculative-led: 32 of 35 coins higher, cap-weighted about +27 percent on the week and +26 percent over thirty days, led by the speculative end, PUMP +77 percent and ZEC +67 percent, with a best-to-worst spread near 80 points. Dominance held near 68 percent and the stablecoins we track kept their pegs.
In foreign exchange the biggest seven-day move was AUDJPY at +1.0 percent, ranges otherwise tight. In commodities the metals led the week: platinum +8 percent, gold +7 percent and silver +6 percent.
The gains were broad, but the largest moves stayed further out on the risk curve, and the dollar and most FX ranges were comparatively quiet.
Read across the three asset classes, the unusual combination is strength in both precious metals and speculative crypto while the dollar remains comparatively quiet. That is consistent with abundant liquidity or a debasement trade, but the tape alone cannot tell us which explanation is driving it.
Subscriber watchlist, with levels
Bitcoin. Fitted floor near 59,000, fair value near 135,000. A weekly close below the fitted floor would be historically unusual and would challenge the model, rather than automatically creating a buying opportunity.
Ether volatility. Current annualised volatility is near 102 percent against a historical median around 53. Watch whether the thirty-day classification also flips from calm to turbulent.
The metals. Whether the turbulent bid broadens beyond gold, silver and platinum or fades back to calm.
Pegs and dominance. Stablecoins are holding and bitcoin dominance is near 68 percent. A tracked peg below 0.995 would trigger Levanter’s wobble alert. A sharp dominance move would show the balance within crypto changing.
To score next week
The model calls bitcoin, ether, gold, silver, platinum and USDCHF turbulent, and the rest calm.
In the next issue we score each call the way the model does, whether realised volatility over the week came in above or below the asset’s running-median volatility, and show the hits and the misses.
That is the claim you can hold this Signal to.
This is the Levanter Signal, the weekly subscriber note, free for now while we build the list. We will tell you before that changes. Subscribe at read.levantermarkets.com. The daily, weekly and monthly reviews stay free at levantermarkets.com.
Educational market analysis, not financial advice.