


The Levanter monthly Signal. A deeper monthly read of volatility, valuation and positioning across crypto, FX and commodities. This is the subscriber tier, and it is free while we build the list. We will tell you before that changes. Subscribe at read.levantermarkets.com.
A strong month does not undo a hard year. Crypto is up a fifth since July and still down about half over twelve months, so I am reading this as room to stay patient rather than a reason to chase. Metals and the largest coins bid together while the dollar stayed quiet, which looks to me like liquidity hunting for a home rather than conviction about anything in particular, and liquidity can leave as fast as it arrives. The number I would sit with is not the plus twenty in crypto but the coin-flip direction record beside it, so enjoy the green, size for the drawdowns, and do not mistake a good month for a good year.
A note on this first monthly issue
We compute month figures by comparing the close we stored on the last day of last month with the close we store today. This is the first issue, so there is no stored prior close and the numbers below use a trailing thirty-day window instead. From next month the figures are exact month on month, and this section disappears.
August 2026, by asset class
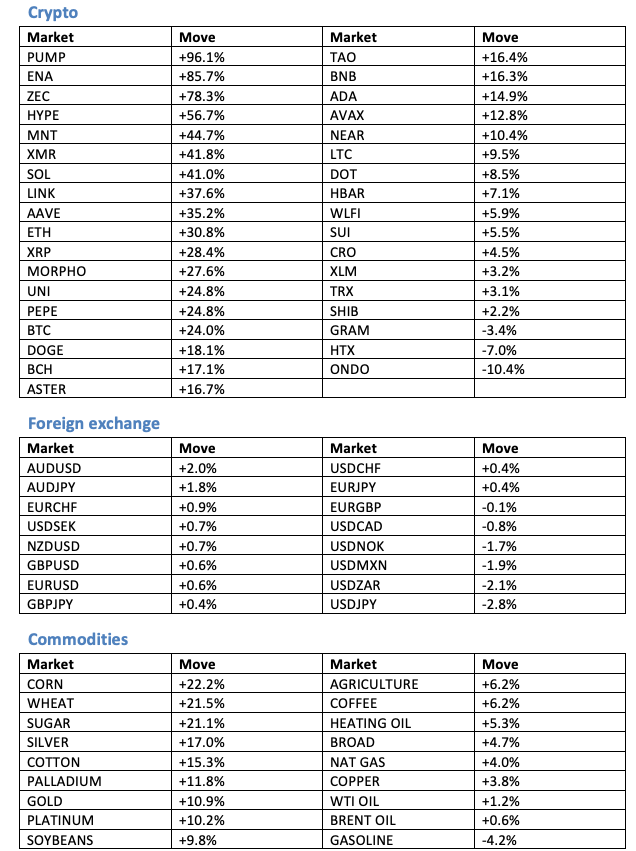
Crypto. 32 of 35 higher, average +23.7 percent. Strongest: PUMP +96.1 percent, ENA +85.7 percent and ZEC +78.3 percent. Weakest: ONDO -10.4 percent, HTX -7.0 percent and GRAM -3.4 percent.
Foreign exchange. 10 of 16 higher, average -0.1 percent. Strongest: AUDUSD +2.0 percent, AUDJPY +1.8 percent and EURCHF +0.9 percent. Weakest: USDJPY -2.8 percent, USDZAR -2.1 percent and USDMXN -1.9 percent.
Commodities. 17 of 18 higher, average +9.3 percent. Strongest: CORN +22.2 percent, WHEAT +21.5 percent and SUGAR +21.1 percent. Laggards: GASOLINE -4.2 percent, BRENT OIL +0.6 percent and WTI OIL +1.2 percent.
The month against the year
One month tells you almost nothing on its own. The table sets the median market in each class against its own six and twelve month record, so you can see whether this month was ordinary, or the outlier the headline number makes it look.

Medians, not averages, so a single runaway name cannot carry the row. Where a market has too little history for a horizon it is left out of that column rather than padded.
That crypto row is the number to sit with. The median coin rose 16.7 percent this month and is still down 52 percent over twelve months, across the 33 coins with a full year of history. A strong month inside a bad year is a different thing from a recovery, and the monthly number on its own cannot tell you which one you are looking at. This is the gap between a good month and a good year, and it is where position sizing is decided rather than where it is celebrated.
Drawdown is the other half of that picture. The median coin sits 11 percent below its own recent high and the deepest is 22 percent under, across 35 names. Our risk banding puts 6 of them in the low band, 26 in the medium and 3 in the high. A month can be green and still leave the whole board under water, which is why we quote the distance from the high next to the return rather than instead of it.
Breadth inside crypto. The equal-weighted basket returned +23.7 percent against +25.3 percent cap-weighted. The heavyweights carried the move and the average coin lagged them, so the rally is narrower than the index return suggests. Bitcoin dominance is near 69 percent.
The one chart: bitcoin against its long-run trend
Bitcoin is near 78,000 dollars. The valuation fit models price against how long the network has existed, on a log-log scale. Fair value on that fit lands near 135,000, with bitcoin about 43 percent below it, and the fitted floor sits near 59,000. Bitcoin has closed above that floor for roughly 95 percent of the historical sample. That is an in-sample observation, not a tested probability and not a guaranteed level of support.
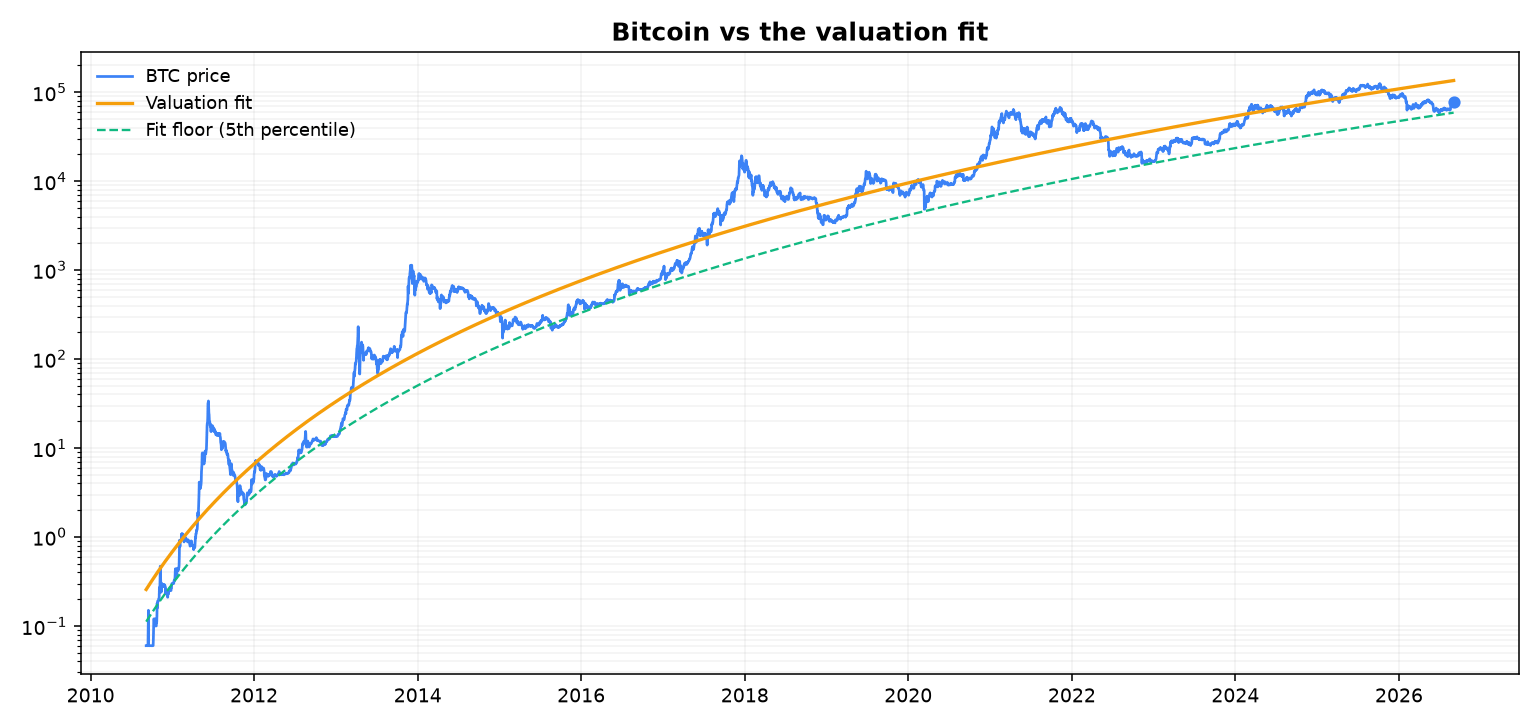
Our cycle gauge reports a second number. It fits the same shape of curve, price against network age, but on a different price history and with a different band, then adds halving timing to classify the phase. It reads bitcoin as post-peak cooldown, about 45 percent below its own trend line. Do not read the two figures as confirming each other. They are the same kind of fit run over overlapping data, so close agreement is near enough guaranteed and tells you nothing the first number did not. On a monthly horizon this is the number that matters most, because valuation says far more about a year than about a week.
The majors against their own trend lines
Bitcoin is not the whole of crypto and the majors do not sit at the same point on their own curves. Each row below is fitted separately, against that asset’s own history, so the comparison is like for like.

The bitcoin fair value in this table is the cycle gauge’s, which is why it differs from the 135,000 quoted above. Two fits, two price histories, two answers. We show both rather than picking the one that reads better.
The ether to bitcoin ratio is 0.0312, around the 30th percentile of its own range, +8 percent over six months. Leadership inside crypto rotates, which is why a single crypto number hides more than it shows.
We are 863 days past the 2024 halving, with the next due in April 2028, and the gauge reads the phase as post-peak cooldown.
What the model can and cannot do
It is a statistical fit of price to time. It has no hard economic mechanism behind it, cannot call tops, and may fail outside the historical sample. It is a valuation anchor rather than a timing tool. Treat the fair value and the floor as distant reference points, never as targets and never as a reason to size up.
The thirty-day volatility map
This is the part with measurable skill. The model tags each market turbulent or calm for the month ahead. In the point-in-time backtest it classified the thirty-day regime correctly about 74 percent of the time across 1178 calls, 95 percent interval 71 to 76, 20 points above its naive baseline, and 72 percent at ninety days. That is a backtest rather than a live forward record, and the live scoreboard is only now filling.
Accuracy on its own flatters a model that never commits, so we also score the confidence behind each call. The Brier score is 0.198 against 0.248 for always guessing the base rate, a skill score of 0.205 over 589 scored calls. Positive but small. Read the calls as a lean rather than a conviction, and size accordingly.
For the month ahead it reads gold, silver, oil, platinum, palladium, Brent crude and 6 others as turbulent and the rest of the board as calm. Average cross-asset correlation is near 0.56, so diversification is thin.
Worth naming: every market the model calls turbulent this month is a commodity. It reads the whole of crypto and foreign exchange as calm. Turbulence is sitting in one corner of the board rather than spread across it, which is a different picture from a market that is simply nervous everywhere.
The full board, market by market
This is the model’s working rather than its conclusion. Volatility is annualised. The median column is each market’s own long-run median, so every row is judged against itself and not against a common threshold. Percentile is where the current reading sits in that market’s own history.
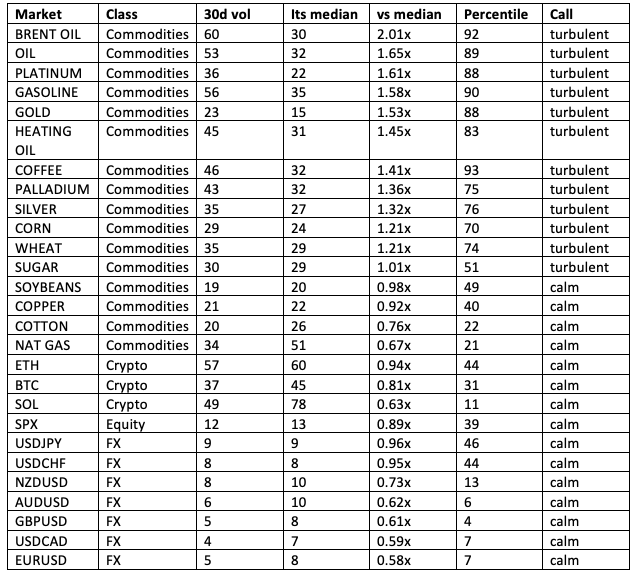
The most stretched reading on the board is BRENT OIL, running 2.01 times its own median. A market can be called turbulent while still sitting below another market’s calm reading, which is the point of judging each one against itself.
Treat the rows near the line with less confidence than the rest. SUGAR at 1.01x, SOYBEANS at 0.98x, USDJPY at 0.96x and USDCHF at 0.95x are close enough to their own medians that the call could go either way, and we would rather flag that than present every row as equally settled. The ones worth acting on are the stretched readings at the top and the quiet ones at the bottom.
What has changed?
This is the first monthly Signal, so there is no prior month end to difference against. We do have our own weekly record from inside the month, and it shows the month had a direction rather than just an end state.
Between our weekly Signal for the week of 24 August and the one for the week of 31 August, the number of markets the model called turbulent went from 6 to 11. Newly turbulent: Brent crude, coffee, cotton, gasoline, heating oil, oil, palladium, sugar and wheat. Calmed back to normal: USDCHF, bitcoin, ether and platinum.
Read those two lists together rather than separately. Turbulence did not simply increase, it moved: out of the names that calmed and into the ones that flipped. That is the same rotation the thirty-day board shows at month end, caught while it was happening rather than inferred from the finish.
Bitcoin went from 42 to 43 percent below its fitted value over the same stretch, with price easing from 78,976 to 77,411 dollars. A wider discount on a lower price is the fit doing what it should, not a signal in itself.
Two caveats worth stating. These are seven-day classifications from the weekly Signal, not the thirty-day calls used above, they are keyed to the week they cover rather than the day they were drawn, and two snapshots is a short record. From next month this section compares month end against month end directly, on the same horizon as the rest of the note.
Subscriber watchlist, with levels
· Bitcoin. Fitted floor near 59,000, fair value near 135,000. A monthly close below the fitted floor would be historically unusual and would challenge the model, rather than automatically creating a buying opportunity.
· Ether volatility. Thirty-day annualised volatility is near 57 percent against a historical median around 60. The thirty-day classification currently reads calm.
· The metals. Whether the turbulent bid broadens beyond gold, silver, platinum and palladium or fades back to calm.
· Pegs and dominance. Bitcoin dominance is near 69 percent. Of the 16 stablecoins we track the weakest print this month was USDF at 0.9959, still above the 0.995 line that triggers Levanter’s wobble alert. We publish the weakest reading rather than a pass mark, because the number is the point.
To score next month: the model calls gold, silver, oil, platinum and 8 others turbulent and the rest calm. In the next issue we score each call the way the model does, whether realised volatility over the month came in above or below the asset’s running-median volatility, and show the hits and the misses. That is the claim you can hold this Signal to.
One honesty section to close, quoted by asset class rather than blended into a single number. On direction our crypto calls run about 49 percent over 320 backtested calls, 95 percent interval 44 to 54. That is a coin flip.
Commodities read 62 percent over 90 calls. We do not present that as an edge and you should not read it as one. The sample is small, commodity moves are serially correlated so consecutive calls are not independent bets, the window trended, and we scored three asset classes. The highest of three is the one most likely to be luck.
FX has no scored sample yet, so we quote nothing for it rather than filling the gap with the blended figure.
These are backtested calls over a fixed window, May to August 2026, not a live public record, and we label them that way every time. We publish them because the number is the point. Volatility is forecastable and we forecast it. Direction is not, so we do not sell it.
What would make this read wrong
Every claim above is checkable, so here is what would falsify it. These are the things we will be marked against, not a disclaimer.
· The concentration breaks. We say turbulence is sitting in one corner of the board. If crypto or the dollar pairs flip turbulent next month while the commodity complex calms, the rotation read was wrong, not early.
· The hit rate slips. The classifier runs about 74 percent in backtest. If next month’s scored calls come in materially under that, the backtest was flattering the live model and we will say so in the scoring.
· Bitcoin closes below the fitted floor. Near 59,000. That has happened in roughly 5 percent of history. A monthly close under it does not confirm the model, it challenges it, and we would report it that way.
· A tracked peg breaks 0.995. The weakest this month was USDF at 0.9959. Below that line the wobble alert fires and the calm reading across crypto stops being the whole story.
· Correlation keeps climbing. Near 0.56 now. Higher and the calm names stop being a diversifier, which would matter more than any single call on this page.
Appendix: every market we track
The full month for every market on the board, not a selection. Ranked within each class. This is the same data the summary above is drawn from.
*This is the Levanter Monthly Signal, the subscriber note, free for now while we build the list. We will tell you before that changes.
Subscribe at read.levantermarkets.com.
The daily, weekly and monthly reviews stay free at levantermarkets.com.
Educational market analysis, not financial advice.*